Article
Reading the Signals: Is Brick-and-Mortar Retail Recovering?

It’s May 2021 and the signs of retail recovery from the COVID-19 pandemic are looking positive in the United States. Several states have reported no daily deaths as well as a decline in new case counts, and more than half of the U.S. adult population have received at least one vaccination shot. This great news has led to justifiable optimism across the country, but what do these improvements tell us about brick-and-mortar retail?
There have been some reports that in-store retail is “back” because shopper traffic is significantly up over last year. But is that a good indicator of retail health? Are there better barometers that plot the path to retail recovery? Most importantly, what are the false signals that could lead to critical mistakes in the retail C-Suite?
Brick-and-Mortar Traffic Patterns During the First Year of the Pandemic
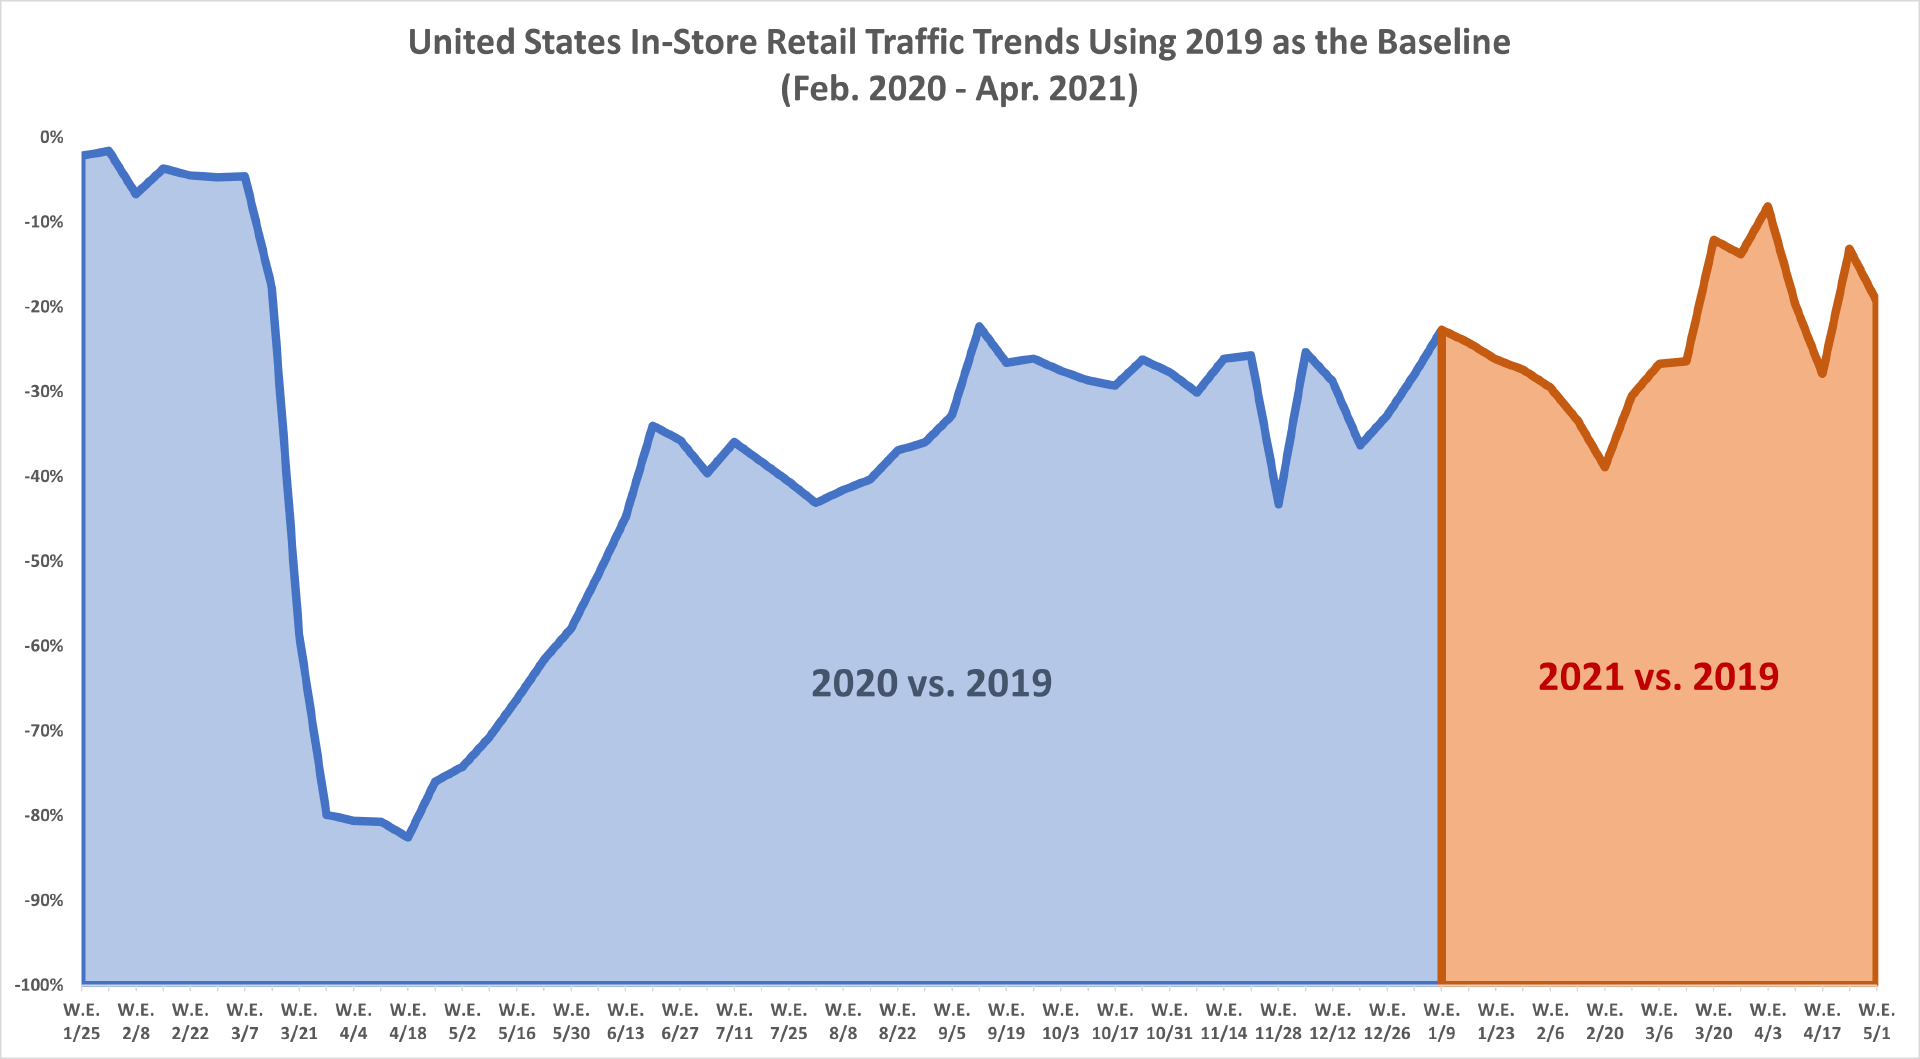
The pandemic started impacting retail 14 months ago, when in-store traffic plummeted from a year-over-year baseline of -5% during the week of March 7, 2020, down to -59% for the week of March 21, 2020. For those not familiar with these indexed comparisons, they represent the change for in-store traffic between 2020 and 2019 for the identical set of retail stores across the country. A small drop of -5% is understandable given the continued growth of online shopping but losing more than half of the in-store shopper base at -59% was the worst drop in retail history. This number ultimately bottomed out in mid-April 2020, when the index fell to -83% as state and local governments prevented “non-essential” retailers from opening their doors and limited operating hours of “essential retailers.”
Brick-and-mortar retail received a lifeline when the first round of stimulus checks started to arrive on April 18, 2020. In-store traffic steadily rose into the -20% to -30% range from Labor Day through mid-November, but traffic fell during the 2020 holidays. In addition to starting earlier within the traditional holiday season, many shoppers increased online spending, forcing in-store traffic back into the -30% to -40% range. 2020 was filled with uncertainty, and the trends in retail traffic and consumer sentiment reflect that.
Shoppers completely changed their shopping habits, spent less in stores, accelerated their online purchase habits, and even changed their daily shopping practices from weekends to weekdays to reflect their new stay-at-home routines. Since December 2020, we’ve seen another shift in shopping behavior, leading us to the current confusion over comparison periods for retailers and analysts alike.
Sensormatic Solutions’ Spring 2021 U.S. Consumer Sentiment Survey revealed a shift towards restored confidence among consumers to shop in-store one year into the COVID-19 pandemic. Read more at Forbes.
Evaluating 2021 Traffic Patterns
The traffic patterns for 2020 were a roller coaster between varying levels of state and federal restrictions and individual concerns over social distancing. Therefore, it makes the most sense to eliminate the year from trend comparisons and instead focus any 2021 comparisons on 2019 again (as visualized in the graph below). Since 2019 was the most recent normalized year, the fact that we are continuing to use it will make the resulting trends for 2021 consistent with what we witnessed in 2020, but without all the noise and inconsistency of the pandemic.
For example, let’s look at the last few weeks of March 2021. There were media reports that these two weeks signaled the return of in-store retail because traffic in both weeks was up substantially over last year. This is misleading because last year was significantly down in comparison to 2019.
Final Two Weeks of March Traffic Comparison
| Comparison | Date Ranges | US Traffic Index |
|---|---|---|
| 2020 vs. 2019 | Mar 22 – Apr 4, 2020 vs. Mar 24 – Apr 6, 2019 |
-80% |
| 2021 vs. 2020 | Mar 21 – Apr 3, 2021 vs. Mar 22 – Apr 4, 2020 |
385% |
| 2021 vs. 2019 | Mar 21 – Apr 3, 2021 vs. Mar 24 – Apr 6, 2019 |
-11% |
While seeing traffic levels at nearly 5x where they were in 2020 looks amazing, considering that traffic was down -80% in 2020 compared to 2019, the increase between 2020 and 2021 doesn’t tell the true story. The -11% index comparing 2021 to 2019 is more reflective of the real trend and indicates that for those two weeks, traffic was getting closer to the levels last achieved two years ago – a very positive sign for retail. To add some further evidence, the trend from the six weeks before the end of March was -28%, comparing 2021 to 2019. That means that from March 21 – April 3, 2021, the index picked up nearly 17 points (-11% vs. -28%), which was a great indication of retail health.
But context is also important. Why would the last two weeks of fiscal March jump so much higher than the prior six-week trend? The third wave of government stimulus checks occurred around that time and as our analysis indicates, the last two series of checks coincided with an uptick in traffic for about two weeks before settling back into prior traffic trends (see graph below).
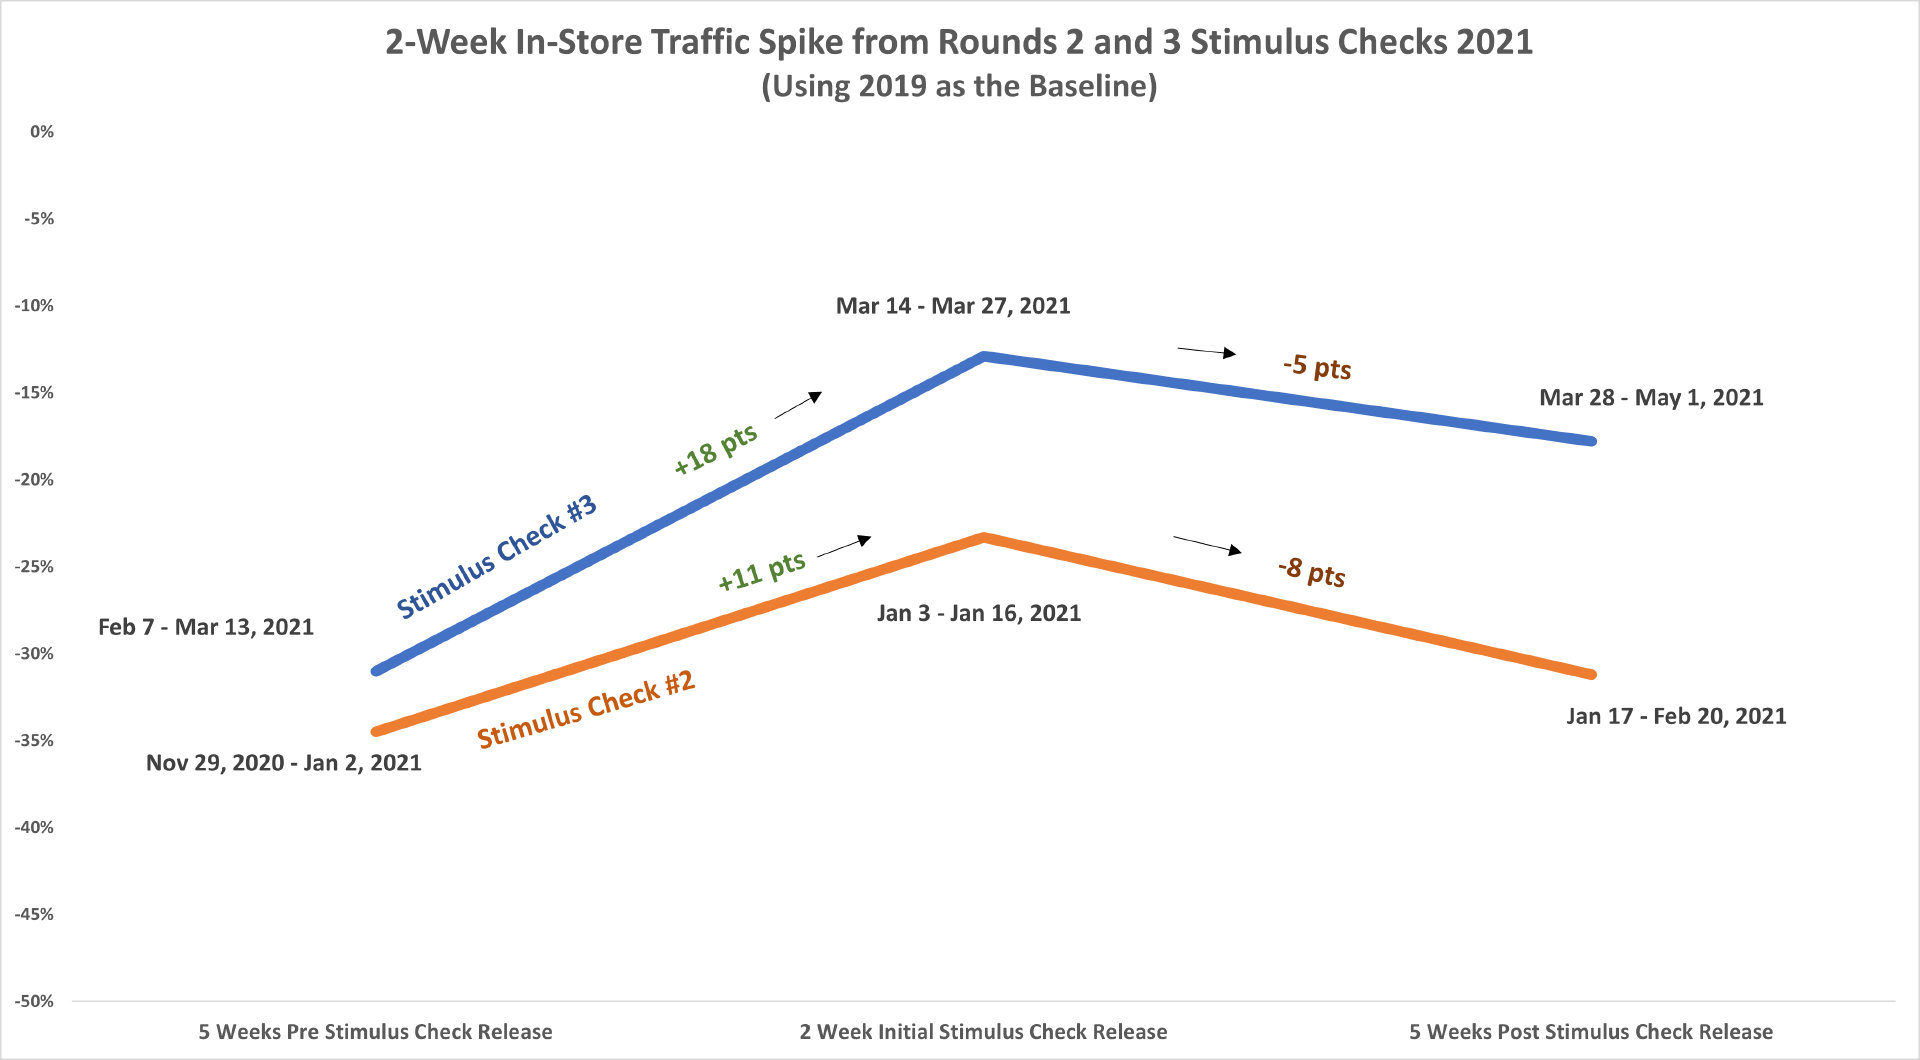
This is not the first time retailers have had to contend with context for traffic comparisons. One such example is Easter, which fell on different fiscal weeks in 2019, 2020 and 2021. This is important because the week leading up to Easter Sunday traditionally is a heavier traffic week as shoppers take advantage of pre-holiday sales. The week of Easter Sunday is usually a lighter traffic week since most stores are closed on Easter Sunday. Since Easter moves around the calendar each year, it is expected that there will be some variability in the traffic performance year-to-year, and so such holiday event shifts should be noted. Considering the impact of the stimulus checks, coupled with the lead-in this year to Easter, the 18-point difference between the last two weeks of March and the prior five-week trend is easily explainable. The good news is that the most recent five-week trend is at -20%, which is better than the trend before mid-March, but no longer offset by the stimulus or Easter holiday.
Looking Ahead to the Next Phase of In-Store Traffic
As we round the corner from Memorial Day and head towards Labor Day 2021, it is even more important than ever to look back to 2019 for guidance on how well we are doing in brick-and-mortar retail. The most significant event for many retailers is the back-to-school season, and in 2020, there really wasn’t one since most communities hadn’t reopened their schools for in-person learning. That impacted retailers from apparel to big box to office supplies. Trying to understand traffic trends when most schools in 2021 are expected to be open necessitates looking back to the most recent year when that occurred, again 2019. Doing so will not only help retailers assess the improving retail traffic environment, but it will help them get a better understanding of expected shopper patterns – critical for staffing and supply chain optimization.
In the C-Suite, taking the 2021 fiscal calendar and matching it up to 2019 results is the first step to projecting the back half of the year. Additionally, any event shifts from 2019, like Easter, should be noted and accounted for to ensure that there aren’t any false reads when evaluating the results. And remember that while 2020 made retail history, with the right traffic analysis we can ensure it isn’t repeated.